Padlo has three dashboards: a team’s own analytics, the club dashboard and the federation overview.
The short version
You do not choose a dashboard: Padlo shows the ones your role reaches. A player and a captain get their team’s analytics, a club admin the club view. The figures build themselves from the matches you record.
Before you start
Who it is forPlayerCaptainClub adminFederation admin
The view follows your role.
Which dashboard each role gets
| View | Who sees it | Where |
|---|---|---|
| Team analytics | the team’s members and their club’s admin | Team |
| Club dashboard | club admin | My club |
| Federation overview | federation admin | Overview |
Another team’s page answers “Team members only”, because team analytics contain per-player numbers.
Team analytics
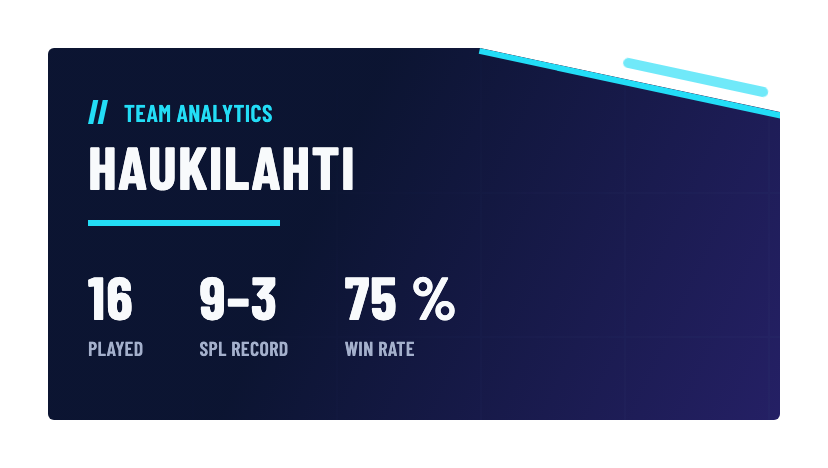
The Analytics tab opens with three figures: matches played, SPL record and win rate. Five sections follow.
The lineup call is the best pairing for three courts in the next team match. It is taken from the top of the pair chemistry ladder so that no player ends up on two courts.
Pair chemistry ranks every possible pair. The tag on each row says where the number comes from:
- Played ×N: the number is measured from real points. A “High confidence”, “Medium confidence” or “Small sample” tag says how much weight it deserves.
- Forecast: the pair has not played together, so their level is predicted from both players’ match data. The row shows pair impact, not a chemistry figure.
- No data: at least one of them has no match data.
Form and trends shows the rolling win rate over five matches and matches per month. Latest results lists the five most recent matches.
Player impact is a player’s average impact per match. Winners, forced errors and assists count as plus; own errors and the shot before an opponent’s winner count as minus. Points played at close scores weigh more.
The club dashboard
A club admin’s My club gathers all of the club’s teams.
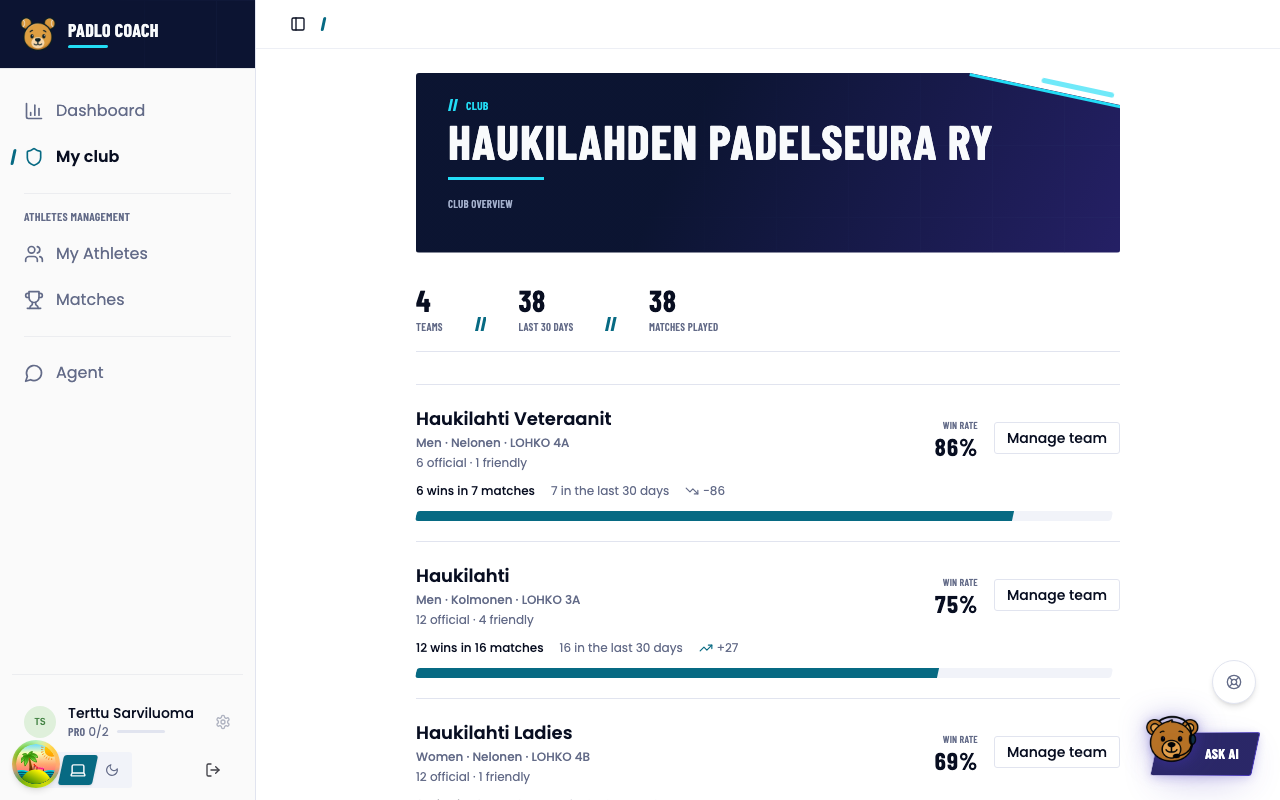
- Three headline numbers: teams, matches in the last 30 days and matches played.
- The team list is ordered by win rate and shows each team’s record, matches in 30 days and trend.
- The player leaderboard ranks the club’s players by win rate. At least three matches are required.
- Show more opens matches per month and player counts per team.
The federation overview
A federation admin’s Overview covers the whole federation, as aggregates only.
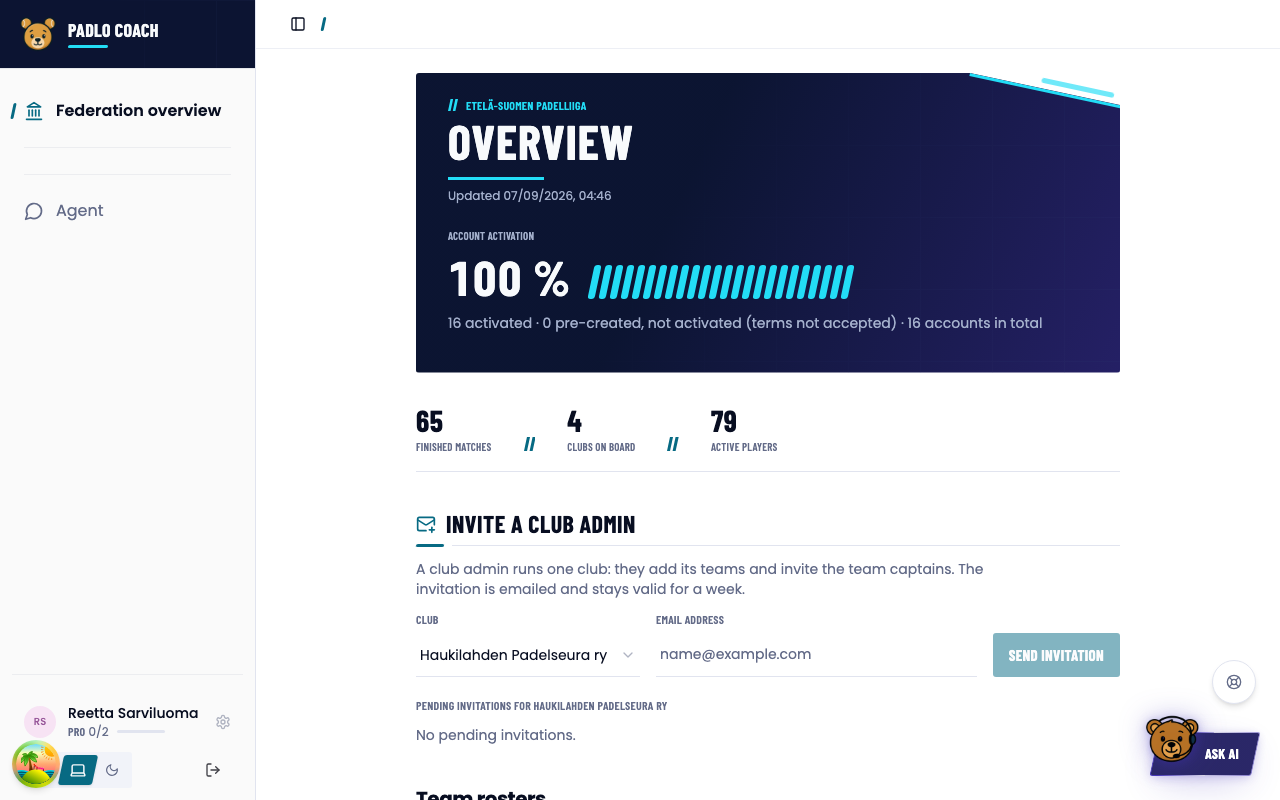
- Account activation: how many accounts have accepted the terms, how many are waiting and how many exist.
- Season figures: completed matches, clubs on board and active players.
- Invite a club admin: the invitation form and open invitations.
- Team players: shortcuts into team management.
- Onboarding status, the app’s own glossary and data freshness. The figures are recomputed nightly and are at most 36 hours old.
Show more opens three sections:
- Weekly digest: matches per week and own errors per match. A falling curve means cleaner play.
- Rating classes: player counts and quality of play by class (A to E and unrated).
- Club comparison: activation, matches and errors per match side by side.
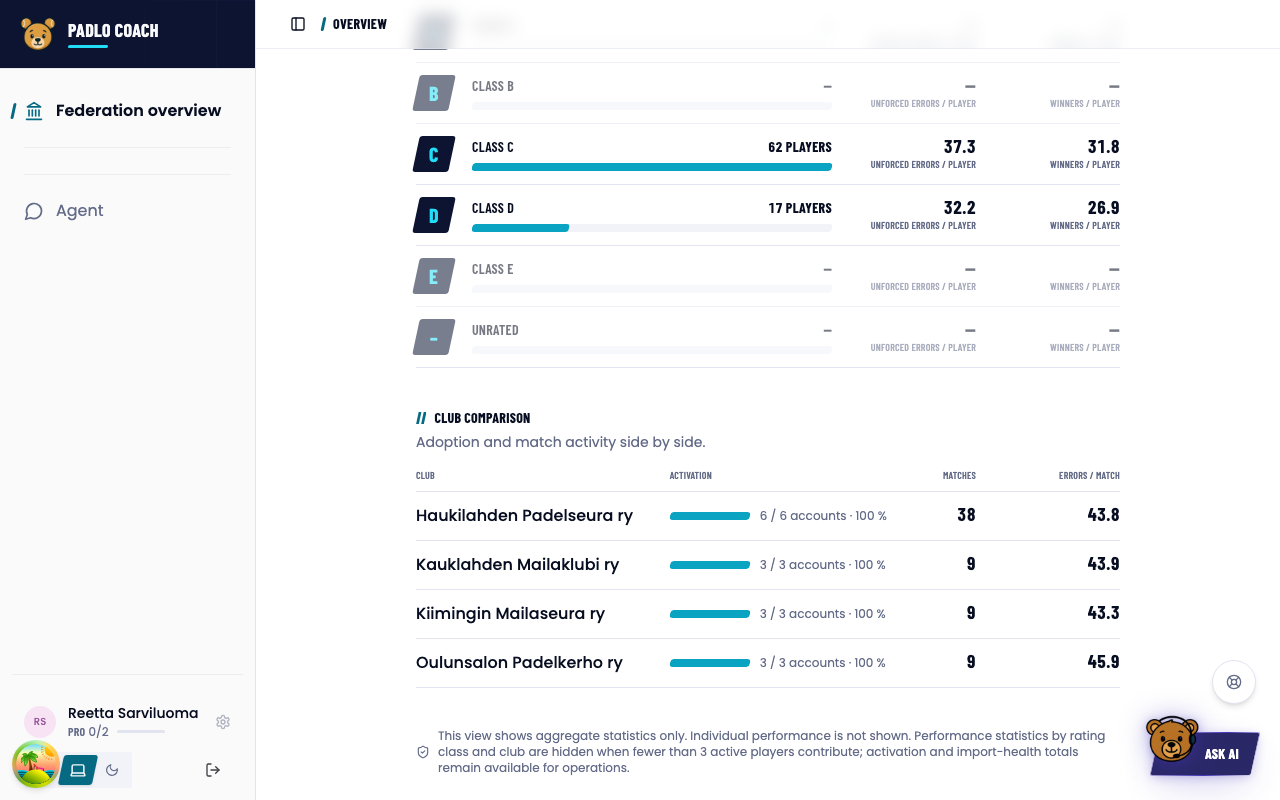
Groups of fewer than three players are hidden
If a rating class’s or a club’s performance figures would come from fewer than three active players, they are replaced with “Hidden · fewer than 3 players”. Otherwise one person’s results would be exposed.
Only performance figures are hidden. The player count, account activation and match counts still show, because they say nothing about anyone’s play.
Good to know
Trouble?
Why did the numbers not update right after the match?
The federation overview is recomputed nightly and is at most 36 hours old. Team analytics and the club dashboard update sooner.
Why do win rate and match count disagree?
The match count includes every completed match, the win rate only those with points recorded.
Why is team analytics locked?
It is visible only to the team’s members and the club’s admin. Ask the captain to add you to the team.